Showing posts with label Report. Show all posts

Monday, 10 December 2012

Refreshing a report Everytime it runs

In cases, where we need to refresh a report surpassing the Cache everytime, we can create a report with a column hidden and making the column formula as-
CURRENT_TIMESTAMP
This will make the report run every time, for every change in second.

Comments are always welcome...

Thursday, 4 October 2012

Date Format change based on Locale Setting

 
This piece of information is a very base to locale setting.
 
When a user requested to change the date format, as the user couldnt always make the changes after downloading to excel.

So the change was to be made for the users setting instead of going globally.
 
We can either ask the user to login with the Language which is expected to produce the date format.


Else we ask the user to go the Settings-->My Account and make the below changes and finish the task and check the results.
Below is the default setting found for the user with English Language.
 
And the result would be-
 
After the changes in the My Account Setting-


The result would be-


Comments are always welcome...


Friday, 7 September 2012

Maximum value from Multiple Columns

One of the user in OTN forum had this question, to display the maximum value with MULTIPLE column values.
For Example-
If you have metric columns 1,2,3

             Metric 1        Metric 2       Metric 3
                 1                         2                   3
                 4                         5                   6
In the above example Metric 3 with value 6 should be shown as the maximum value.
Before going ahead read the post- http://obiee10grevisited.blogspot.com/2012/07/highest-value-in-narrative-view-rank.html

This is probably my way to resolve this, but hope to see comments, arguments and other better ways to resolve this issue.
I built a report with Metric 1 column and then made use of the combine with similar request for the second Metric 2 and again combined with Metric 3 column.

And in the column which has the metric columns make its sorting as descending, so that it shows the max value at the first position.

In the narrative view, use any customized message and in the 'Rows to display' set it as 1. So that it always shows the max first value
 
 
And the result...


Comments are always welcome...


Tuesday, 7 August 2012

Changing the Date Format from Presentation Variable

In OTN forum I came across a requirement, where the user wanted to change the date format of a presentation variable value.

Assuming the presenatation variable value is acquired through a prompt, I am proceeding by creating a report with a column which is filtered with this presentation variable.


The column in a report which is having a default value with the presentation variable.

Next is to change the data format of the date column, so that we change the format of the date column on receiving the value from the prompt.


Final result.


Comments are always welcome...


Tuesday, 24 July 2012

Vertical Alignment of Text

When there is a requirement to show the values into horizontal or vertical alignment, then this post can do the miracle to the requirement.
All we need to do is we need to put the below piece of code in the Column Properties-->Use Custom CSS Style(checked)

Writing-mode: tb-rl; filter: flipv fliph;


I have also put the below code by removing the flipv and fliph keywords in the above code
Writing-mode: tb-rl; filter: flipv;
Writing-mode: tb-rl; filter: fliph;


.


Comments are always welcome...

Monday, 23 July 2012

Right and Left Function in OBIEE

This is a basic report, but still wanted to make this post to show the results compared.
When we would need to use the left side or right side values from a column then we do have String Function-Right and Left Function
So in the column formula we can pull the String Functions-Right and Left function and check the Syntax.

Syntax-RIGHT(Column_name,integer) and LEFT(Column_name,integer)


And the result Comparison.


Comments are always welcome...

Thursday, 5 July 2012

Conditional Hyperlink/ Removing Conditional Hyperlink

In OTN forum, I came across a good requirement and I tried the same.
Cases where you need to keep/ remove the conditional underline  of a text while showing navigation can be handled by our user friendly HTML script. This can be played under the impression where customized text is required for the navigation.
Below piece of code shows the text to represent without an underline beneath the data values. And also do note that the pointer shape is replaced with default to remove the 'Hand' symbol.  You also need to change the Data format of the column to HTML


Save and see the result...


Comments are always welcome...

Left Indent on OBIEE 11g

I have seen couple of questions raising for changing the indent style of the data values in the OTN forum and also me myself had a requirement in OBIEE 11g to change the style of the data values to indent 20 from left. We found to add the indent properties to 20 and see the change.
But you can also still trust on css properties. And of course, both the trick plays their role perfectly.

Take a reference of the below screenshot-


Save and check the results...

Also try using 'text-indent:30px' and would produce the same results

Comments are always welcome...

IsNumeric or NOT

I needed to show the column values containing numbers as 'Numeric' and the values without the numbers as 'Alphabets'. I would first validate the column values with the case statement, if it is containing any numeric value. If it doesnt contain then it is named as 'Alphabets'
And on top of it I need to show the custom messages back ground with different colors.
I have tried the below method with HTML and with conditional formatting.

First method approach is with HTML and case statement.

case when ("Products"."Product" like '%1%')
OR ("Products"."Product" like '%2%')
OR ("Products"."Product" like '%3%')
OR ("Products"."Product" like '%4%')
OR ("Products"."Product" like '%5%')
OR ("Products"."Product" like '%6%')
OR ("Products"."Product" like '%7%')
OR ("Products"."Product" like '%8%')
OR ("Products"."Product" like '%9%')
OR ("Products"."Product" like '%0%')
then '<span style="background-color:Red">Numeric</span>'
else '<span style="background-color:Green">Alphabets</span>'
end


Second method with conditional formatting and case statement.

Here you need to add the below code in the column formula

case when ("Products"."Product" like '%1%')
OR ("Products"."Product" like '%2%')
OR ("Products"."Product" like '%3%')
OR ("Products"."Product" like '%4%')
OR ("Products"."Product" like '%5%')
OR ("Products"."Product" like '%6%')
OR ("Products"."Product" like '%7%')
OR ("Products"."Product" like '%8%')
OR ("Products"."Product" like '%9%')
OR ("Products"."Product" like '%0%')
then 'Numeric'
else 'Alphabets'
end

and in the column properties-->conditional formatting-->add condition


Save and check the results...

Comments are always welcome...


Scope of Variables

You can reference variables in the following areas:

-Title Views
-Narrative Views
-Column Filters
-Column Formulas
-Conditional Formatting conditions (presentation variables only)
-Direct Database Requests
-Dashboard prompts
 Users will be prompted for a variable value which is then set into a request (session)   variable and passed to the Oracle BI server.
-Chart scale markers.
-Gauge range settings.
-Static text.
-iBot Headlines and text

Prompt with Combined Subject Area

Values produced from a single subject area in the prompt can be used to filter the data in the report. But if we need to combine the results of both the columns in two different subject area then we need to combine both the columns using a UNION request in the SQL results.

Lets start with the creation of the prompt. We first pull the column from the first subject area and in Options-->Choice List Values-->SQL Results. We copy the Logical SQL query from the first prompt.
For Example-SELECT "Time"."Per Name Year" FROM "Sample Sales Lite"

Next, we create a second prompt and as the steps mentioned above try to copy the Logical SQL results from the second prompt with a different subject area.
For Example- SELECT "Time"."Per Name Half" FROM "Sample Targets Lite"


We combine the first Logical SQL query with the first logical SQL query with a union between the two SQL clause.
Now the query looks similar to the below-

SELECT "Time"."Per Name Half" FROM "Sample Targets Lite"
union
SELECT "Time"."Per Name Year" FROM "Sample Sales Lite"

Save and check the results...


Comments are always welcome...

Change Cursor Types

We can change the shape of the cursor while pointing to the text in the column. This can be achieved by adding a small css cursor property in the column properties in the style fo the column.

For Example-
cursor:move;


And check the results...

Cursor Types to Try-

-auto
-crosshair
-default
-e-resize
-help
-move
-n-resize
-ne-resize
-nw-resize
-pointer
-progress
-s-resize
-se-resize
-sw-resize
-text
-w-resize
-wait
-url(smiley.gif),url(myBall.cur),auto

Comments are always welcome...


Monday, 2 July 2012

Change the Date Format/ Evaluate Function

OTN forum keeps on getting the requests for changing the default date formats. They need to either pass the presentation variable into the desired date formats or change the date formats in the reports. Many blogs would represent different methods or representing them. In this post I will show three different methods of representing the Date formats and a final screen show casing the final comparison of the three methods.

I am pulling four columns-
First is the original Date column
Second is the Evaluate Date column
Third is the Custom Date column
Fourth is the Cast Date column


First method- EVALUATE Function.


Second method- Changing with custom Date format in the Data format.


Third method- Casting with Date format.


And the final comparison of the above three methods.


And also try the below formatting in the RPD side-

-In the physical layer in the schema general properties-try to change the types after searching for DATE.
-the execute on connect of the connection pool write the below code-
ALTER SESSION SET NLS_DATE_FORMAT = 'MON-YYYY'


Comments are always welcome and please add on if any other methods could do the trick.


Highest value in the narrative view/ Rank

We needed to show the Highest value for a measure column in the narrative view. The report for example will consist of two columns- dimension and measure column.
I placed a dummy column for finding the highest value of the measure by using RANK function in the column formula and calculating its position using javascript.


First will drag a dummy column of the measure and use the rank function as shown below-


Next will be using javascript to calculate the appropriate position of the 1st highest value of the measure column.


<script language="javascript" type="text/javascript">
for(var i=0;i<1;i++)
{
var a=@3;
if(a==1)
{
document.getElementById("Format").innerHTML='Biggest Profit-->@2';
}
}
</script>


And save and view the result...


Comments are always welcome...

Friday, 29 June 2012

Thousand separator in Narrative View

To display the thousand separator comma for the measure values in the Narrative view Bill suggested to use the HTML format.
https://forums.oracle.com/forums/thread.jspa?threadID=2393458&tstart=15

Use the below format in the narrative view with HTML enabled.

<td id="Format" style ="vertical-align: top; text-align: right; width: 150px;"> @2 <br>
</td>
<script language="javascript" type="text/javascript">
document.getElementById("Format").innerHTML=number_format(@2, 2, '.',',');;
</script>

@2 is the position of the fact measure column.

And also as per Nico-
This is a bug:
NLS:NARRATIVE VIEW DOES NOT USE CRITERIA DATA FORMAT
https://support.oracle.com/CSP/main/article?cmd=show&type=BUG&id=13791979
And it's fixed in the version 11.1.1.7.0 ..

Comments are always welcome...

Pop Up/ New Window

When the user needs to have a new google search window on click on the value and then search the value by default.
We can have the customized html code in the column formula and change the Data format of the column to HTML.
'<a target="_blank" href="http://www.google.com/search?hl=en&q=' ||col_name||'&btnG=Google+Search">'||col_name|| '</a>'


After clicking on the value-


Also follow the below link for opening to a new window within the report-
http://shahin-obiee.blogspot.in/2012/05/normal-0-false-false-false-en-us-x-none.html
Comments are always welcome...

Data Level Security


I know I am re-inventing the wheel for Data level security. But I want to show the obiee beginners a simple guide to implement the same. Hope people out there struggling to implement Data level security will get a hint to build it.

Data Level security is implemented in the case when the user logging in views the data which he/ she has the access to. This includes to include a system session variable 'USER'to capture the user's logging credentials and apply it to the reports query.

I am having three tables for serving their purpose.
1. Dimension Table - DIM2
2. Fact Table  - FACT1
3. Security Table -SECURITY_1

Data present in the above tables is shown below-


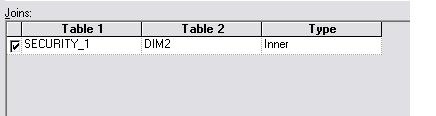
Next we need to import the three tables in the RPD and do the below joins-


Joins with Dimension and Security table in physical Layer

"DIM2"."COUNTRYID" = "SECURITY_1"."COUNTRYID"

Joins with Fact and Security table in physical Layer

"FACT1"."EMPID" = "SECURITY_1"."EMPID"

Joins with Fact and Security table in physical Layer

"DIM2"."COUNTRYID" ="FACT1"."COUNTRY_ID"


In the BMM layer for the dimension table we need to make the below changes. This change is used to apply when the user selects only the dimension column. So that the values which he/ she has the access will be shown after making the joins with the security table. For example- On clicking of the Prompt values.


And the below change in the Content Tab -where clause


In the BMM layer for the fact table we need to make the below changes. Data will be restricted after making joins with the security table and joins with the dimension  table. You can try removing the joins with the dimension and security tables which is not mandatory, since we are joining with the fact and security tables.


And the below change in the Content Tab -where clause


Now its time to view our reports in answers. When the user logs in with 100 as empid then the user is allowed to view only his/ her data.


With the Fact column-


When the user with 200 empid logs in-


Prompt value shown for the user with empid 200

Below are the queries generated-

For Dimension Security

WITH SAWITH0 AS
  (SELECT DISTINCT T222731.COUNTRY_NAME AS c1
  FROM OBIEE_DBA.SECURITY_1 T222728,
    OBIEE_DBA.DIM2 T222731
  WHERE ( T222728.EMPID = '100'
  AND T222728.COUNTRYID = T222731.COUNTRYID )
  )
SELECT DISTINCT 0 AS c1, D1.c1 AS c2 FROM SAWITH0 D1 ORDER BY c2

With Fact Dimension columns with Security tables joins. With user with login id as 100

WITH SAWITH0 AS
  (SELECT DISTINCT T222731.COUNTRY_NAME AS c1,
    T222734.SALARY                      AS c2
  FROM OBIEE_DBA.SECURITY_1 T222728,
    OBIEE_DBA.DIM2 T222731,
    OBIEE_DBA.FACT1 T222734
  WHERE ( T222728.EMPID = T222734.EMPID
  AND T222728.EMPID     = '100'
  AND T222728.COUNTRYID = T222731.COUNTRYID
  AND T222731.COUNTRYID = T222734.COUNTRY_ID )
  )
SELECT DISTINCT 0 AS c1,
  D1.c1           AS c2,
  D1.c2           AS c3
FROM SAWITH0 D1
ORDER BY c2,
  c3

With user with login id as 200

WITH SAWITH0 AS
  (SELECT DISTINCT T222731.COUNTRY_NAME AS c1,
    T222734.SALARY                      AS c2
  FROM OBIEE_DBA.SECURITY_1 T222728,
    OBIEE_DBA.DIM2 T222731,
    OBIEE_DBA.FACT1 T222734
  WHERE ( T222728.EMPID = T222734.EMPID
  AND T222728.EMPID     = '200'
  AND T222728.COUNTRYID = T222731.COUNTRYID
  AND T222731.COUNTRYID = T222734.COUNTRY_ID )
  )
SELECT DISTINCT 0 AS c1,
  D1.c1           AS c2,
  D1.c2           AS c3
FROM SAWITH0 D1
ORDER BY c2,
  c3


Comments are always welcome...

Thursday, 28 June 2012

Hierarchy in Answers

Hierarchies can be created in the RPD and viewed in the answer report. Hierarchies plays an important role in OBIEE to see the drill down hierarchy order. In RPD hierarchy is created according to the requirement and viewed accordingly in the answers.
Here in my case, I will show you the case of creating a hierarchy based report from the answers directly. But remember this is not a hierarchy columns created from the RPD Hierarchy.
And you need to remember that the values into the column should be in the order of the hierarchy that is to be displayed on the page.
NOTE- Only dimension columns seems to work fine without fact columns.
So, this structure can be used to display a certain hierarchy level without the means of fact columns.

In the report, drag the dimension column which contains the values to be displayed in hierarchial order.

Add a second dummy column in the report with the HTML Data format enabled. Add the mentioned column formula to stimulate the required changes using HTML. I am adding a default RED color to display behind the word.


And view the report and save it.


Comments are Welcome..