In 11g, the user can right click on
the pivot table report and do sorting excluding the column etc.. also a little grey header
on the column heading appears.
This feature is good to some extend and worse in most of the cases. Supposing the user wants to disbale all this, then there should be a way out :)
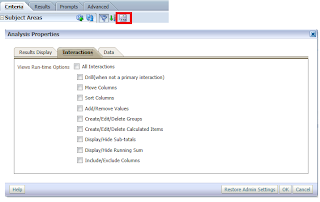
To remove the gray color tab appearing above the column headings in the pivot table.
Just Edit your analysis and then click on "Analysis Properties dialog" then
select Interactions tab here you uncheck all the Interactions link then save it
and test it.
If you want to disable enitre report just add below content in your
instanceconfig.xml file then restart bi presentation services then test it
out.
Include the elements and their ancestor elements as appropriate, as
shown in the following
example:
<ServerInstance>
<Analysis>
<InteractionProperties>
<InteractionPropertyAddRemoveValues>false</InteractionPropertyAddRemoveValues>
<InteractionPropertyCalcItemOperations>false</InteractionPropertyCalcItemOperations>
<InteractionPropertyDrill>false</InteractionPropertyDrill>
<InteractionPropertyGroupOperations>false</InteractionPropertyGroupOperations>
<InteractionPropertyInclExclColumns>false</InteractionPropertyInclExclColumns>
<InteractionPropertyMoveColumns>false</InteractionPropertyMoveColumns>
<InteractionPropertyRunningSum>false</InteractionPropertyRunningSum>
<InteractionPropertyShowHideSubTotal>false</InteractionPropertyShowHideSubTotal>
<InteractionPropertySortColumns>false</InteractionPropertySortColumns>
</InteractionProperties>
</Analysis>
</ServerInstance>
For
More Refer Oracle Note:
http://docs.oracle.com/cd/E23943_01/bi.1111/e10541/answersconfigset.htm#BIESG377218.3.4
Manually Configuring for Interactions in Views
-
Or to individual pivot table report, add this code in the static view and append it to pivot table view
<script type="text/javascript">
var tds =
document.getElementsByTagName('td');
var lCSS = new
Array();
for(var td=0;td<tds.length;td++){
if(
tds[td].className != 'PTCC' ){
if( tds[td].className != 'PTCHC0
PT_CPLCHLD PTLC'
){
continue;
}
}
tds[td].style.backgroundColor="#FFFFFF";tds[td].style.display='none';
lCSS.push(tds[td].innerHTML);
}
for(var
len =0; len < lCSS.length; len++){
}
</script>
Comments are always welcome...


