Tuesday 24 July 2012

Vertical Alignment of Text

When there is a requirement to show the values into horizontal or vertical alignment, then this post can do the miracle to the requirement.
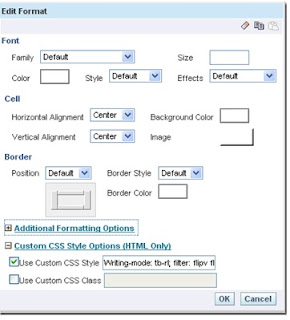
All we need to do is we need to put the below piece of code in the Column Properties-->Use Custom CSS Style(checked)

Writing-mode: tb-rl; filter: flipv fliph;


I have also put the below code by removing the flipv and fliph keywords in the above code
Writing-mode: tb-rl; filter: flipv;
Writing-mode: tb-rl; filter: fliph;


.


Comments are always welcome...

Monday 23 July 2012

Right and Left Function in OBIEE

This is a basic report, but still wanted to make this post to show the results compared.
When we would need to use the left side or right side values from a column then we do have String Function-Right and Left Function
So in the column formula we can pull the String Functions-Right and Left function and check the Syntax.

Syntax-RIGHT(Column_name,integer) and LEFT(Column_name,integer)


And the result Comparison.


Comments are always welcome...

Sunday 15 July 2012

Starting OBIEE in Linux and Unix

Startup the BI services

Set the BI_HOME to the Oracle BI Home path e.g. /opt/oracle/product/OracleBI

$export BI_HOME=/opt/oracle/product/OracleBI
#Start the BI sever
$$BI_HOME/setup/run-sa.sh start
#Start the presentation service
$$BI_HOME/setup/run-saw.sh-start
#Start the scheduler
$$BI_HOME/setup/run-sch.sh start
#Start the cluster controller – only required when BI servers clustered
$$BI_HOME/setup/run-ccs.sh start

Shutdown the BI services

$export BI_HOME=/opt/oracle/product/OracleBI
#Stop the cluster controller – only required when BI servers clustered
$$BI_HOME/setup/run-ccs.sh stop
#Stop the BI sever
$$BI_HOME/setup/run-sa.sh stop
#Stop the presentation service
$$BI_HOME/setup/run-saw.sh stop
#Stop the scheduler
$$BI_HOME/setup/run-sch.sh stop

Friday 13 July 2012

Different Types of Dimensions


I have just copied the contents from stackoverflow and guess that it would be helpful to many people searching for different types of dimensions existing. And I also welcome people to add dimensions which they have come across and update this post if anything is missing or found wrong.

Regular dimension
Standard star dimension.

Time Dimension A special case of the standard star dimension.

Parent-child dimension
Used to model hierarchical structures, fx BOM (bill of materials).

Snowflake dimension
Can also be used to model hierarchical structures.

Degenerate dimensions
When the dimension attribute is stored as part of fact table, and not in a separate dimension table. Typically used for high cardinality dimensions like "transaction number".

Junk dimension
 A single table with a combination of different and unrelated attributes to avoid having a large number of foreign keys in the fact table. Junk dimensions are often created to manage the foreign keys created by Rapidly Changing Dimensions. Typically used for low cardinality, non-related dimensions like gender or other booleans.

Role playing dimensions
For instance, a "Date" dimension can be used for "Date of Sale", as well as "Date of Delivery", or "Date of Hire".

Mini dimensions
For rapidly changing large dimensions. Typically used for managing high frequency, low cardinality change in a dimension.

Conformed dimensions
Implemented in multiple database tables using the same structure, attributes, domain values, definitions and concepts in each implementation. Also seen under the name Shared dimension.

Monster Dimension
 A very large dimension.

Shrunk dimension
Is a subset of a dimension’s attributes that apply to a higher level of summary. For example, a Month dimension would be a shrunken dimension of the Date dimension. The Month dimension could be connected to a forecast fact table whose grain is at the monthly level. Dimension.

Inferred Dimensions
While loading fact records, a dimension record may not yet be ready. One solution is to generate an surrogate key with Null for all the other attributes. This should technically be called an inferred member, but is often called an inferred dimension.

Static Dimension
It not extracted from the original data source, but are created within the context of the data warehouse. A static dimension can be loaded manually — for example with Status codes — or it can be generated by a procedure, such as a Date or Time dimension.

Multi value Dimension
 Is simply a bridge table between the entities involved in the many-to-many relationship. It is also possible that the many-to-many is between a fact and dimension.

Dynamic dimensions. These can be further divided into 2 groups.

Slowly changing dimension/Rapidly changing dimension
Attributes of a dimension that would undergo changes over time
Slowly Growing Dimension/Rapidly Growing Dimension
 Relates to the growth of records/elements in the dimension.

NB: These can then be combined with the size of the dimension table, resulting in "Rapidly Changing Monster Dimension", "Slowly changing mini dimension" etc.

Some other dimensions-

Data Mining Dimensions
 Virtual dimension
 Demographic Dimensions
 Write-Enabled Dimensions
 Dependent Dimensions
 Independent Dimensions
 Primary Dimensions
 Secondary Dimensions
 Tertiary Dimensions
 Informational dimension
Dimension triage dimension
Non-conforming dimensions from the general ledger
 

Thursday 5 July 2012

Conditional Hyperlink/ Removing Conditional Hyperlink

In OTN forum, I came across a good requirement and I tried the same.
Cases where you need to keep/ remove the conditional underline  of a text while showing navigation can be handled by our user friendly HTML script. This can be played under the impression where customized text is required for the navigation.
Below piece of code shows the text to represent without an underline beneath the data values. And also do note that the pointer shape is replaced with default to remove the 'Hand' symbol.  You also need to change the Data format of the column to HTML


Save and see the result...


Comments are always welcome...

Left Indent on OBIEE 11g

I have seen couple of questions raising for changing the indent style of the data values in the OTN forum and also me myself had a requirement in OBIEE 11g to change the style of the data values to indent 20 from left. We found to add the indent properties to 20 and see the change.
But you can also still trust on css properties. And of course, both the trick plays their role perfectly.

Take a reference of the below screenshot-


Save and check the results...

Also try using 'text-indent:30px' and would produce the same results

Comments are always welcome...

IsNumeric or NOT

I needed to show the column values containing numbers as 'Numeric' and the values without the numbers as 'Alphabets'. I would first validate the column values with the case statement, if it is containing any numeric value. If it doesnt contain then it is named as 'Alphabets'
And on top of it I need to show the custom messages back ground with different colors.
I have tried the below method with HTML and with conditional formatting.

First method approach is with HTML and case statement.

case when ("Products"."Product" like '%1%')
OR ("Products"."Product" like '%2%')
OR ("Products"."Product" like '%3%')
OR ("Products"."Product" like '%4%')
OR ("Products"."Product" like '%5%')
OR ("Products"."Product" like '%6%')
OR ("Products"."Product" like '%7%')
OR ("Products"."Product" like '%8%')
OR ("Products"."Product" like '%9%')
OR ("Products"."Product" like '%0%')
then '<span style="background-color:Red">Numeric</span>'
else '<span style="background-color:Green">Alphabets</span>'
end


Second method with conditional formatting and case statement.

Here you need to add the below code in the column formula

case when ("Products"."Product" like '%1%')
OR ("Products"."Product" like '%2%')
OR ("Products"."Product" like '%3%')
OR ("Products"."Product" like '%4%')
OR ("Products"."Product" like '%5%')
OR ("Products"."Product" like '%6%')
OR ("Products"."Product" like '%7%')
OR ("Products"."Product" like '%8%')
OR ("Products"."Product" like '%9%')
OR ("Products"."Product" like '%0%')
then 'Numeric'
else 'Alphabets'
end

and in the column properties-->conditional formatting-->add condition


Save and check the results...

Comments are always welcome...


Scope of Variables

You can reference variables in the following areas:

-Title Views
-Narrative Views
-Column Filters
-Column Formulas
-Conditional Formatting conditions (presentation variables only)
-Direct Database Requests
-Dashboard prompts
 Users will be prompted for a variable value which is then set into a request (session)   variable and passed to the Oracle BI server.
-Chart scale markers.
-Gauge range settings.
-Static text.
-iBot Headlines and text

Prompt with Combined Subject Area

Values produced from a single subject area in the prompt can be used to filter the data in the report. But if we need to combine the results of both the columns in two different subject area then we need to combine both the columns using a UNION request in the SQL results.

Lets start with the creation of the prompt. We first pull the column from the first subject area and in Options-->Choice List Values-->SQL Results. We copy the Logical SQL query from the first prompt.
For Example-SELECT "Time"."Per Name Year" FROM "Sample Sales Lite"

Next, we create a second prompt and as the steps mentioned above try to copy the Logical SQL results from the second prompt with a different subject area.
For Example- SELECT "Time"."Per Name Half" FROM "Sample Targets Lite"


We combine the first Logical SQL query with the first logical SQL query with a union between the two SQL clause.
Now the query looks similar to the below-

SELECT "Time"."Per Name Half" FROM "Sample Targets Lite"
union
SELECT "Time"."Per Name Year" FROM "Sample Sales Lite"

Save and check the results...


Comments are always welcome...

UA.bat hangs in OBIEE 11.1.1.6.2


As a reference-
https://forums.oracle.com/forums/thread.jspa?threadID=2400314&tstart=240

As per Christian-

I did a fresh installation of OBIEE 11.1.1.6 on a Windows Server 2008 R2 Standard 64 bit (I installed the 64bit version) and patched it to 11.1.1.6.2. When trying to upgrade the .rpd file from 10.3.4.1 the Upgrade Assistant simply hangs when clicking on the "next" button after supplying the relevant informations. Setting the ORACLE_HOME environment variable as mentioned in the thread above didn't solve the problem. Also I don't have another oracle home on that machine, so I think I started the correct UA.
When looking at the logfile of UA i get those messages:

[2012-06-11T10:36:58.033+02:00] [Framework] [NOTIFICATION] [] [upgrade.Framework] [tid: 11] [ecid: 0000JVQg5GmBt1YzLofP8A1FpQrf000002,0] Please enter the repository password:
[2012-06-11T10:36:58.051+02:00] [Framework] [NOTIFICATION] [] [upgrade.Framework] [tid: 11] [ecid: 0000JVQg5GmBt1YzLofP8A1FpQrf000002,0] Please enter the 10g Admin password:

I get those log file entries immediately after I press the "next" button. Needless to say I entered the correct admin password and a valid repository password. It also hangs with the same messages in the logfile when I only supply the Admin username but no passwords at all, so I guess even though I enter both passwords UA simply doesn't recognize them and fails to present me a error message.
This worked previously in 11.1.1.6.1 (and also in 11.1.1.5), and there where no changes to the .rpd file so I don't think it's the fault of the .rpd file.

Deepika answered it as-

This is an open bug with oracle, refer to the following bug detail in support web,
Bug 14160867: UA UTILITY HANGS AND DOES NOT PROGRESS AFTER STEP 3 ON 11.1.1.6.2

Comments are always welcome...

Change Cursor Types

We can change the shape of the cursor while pointing to the text in the column. This can be achieved by adding a small css cursor property in the column properties in the style fo the column.

For Example-
cursor:move;


And check the results...

Cursor Types to Try-

-auto
-crosshair
-default
-e-resize
-help
-move
-n-resize
-ne-resize
-nw-resize
-pointer
-progress
-s-resize
-se-resize
-sw-resize
-text
-w-resize
-wait
-url(smiley.gif),url(myBall.cur),auto

Comments are always welcome...


Tuesday 3 July 2012

Log Configuration - 11g

Configure the Business Intelligence log files by choosing what level of message gets logged and when a log file expires. Changes apply to all Business Intelligence log files.

Also refer below for the path of the Log files-


Scaling Oracle Business Intelligence

Scaling is the process of increasing or decreasing the capacity of the system by changing the number of processes available to service requests from Oracle Business Intelligence clients. Scaling out a system provides additional capacity, while scaling in a system reduces capacity. Scaling is also a critical part of configuring a deployment for high availability.

Scaling the Oracle Business Intelligence environment applies principally to resource-intensive system processes and Java components. When you deploy more processes, Oracle Business Intelligence can handle more requests while staying responsive to requests.

Vertical scaling involves adding more Oracle Business Intelligence components to the same computer, to make increased use of the hardware resources on that computer. For example, Oracle Business Intelligence can be vertically scaled by increasing the number of system components servicing requests on a given computer and results in increased use of the hardware resources on a given computer.

Horizontal scaling involves adding more computers to the environment. For example, Oracle Business Intelligence is horizontally scaled by distributing the processing of requests across multiple computers.
You can scale both Oracle Business Intelligence Java components and system components. See Section 1.3.3, "About Java Components and System Components for Oracle Business Intelligence" for more information about these components.

The three system components that support both horizontal and vertical scale-out are Oracle BI Presentation Services, the Oracle BI Server, and the JavaHost.

Oracle BI Scheduler uses Presentation Services and Oracle BI Server processes to perform computationally intense work on its behalf, while the Cluster Controller only manages other components and does not itself do any computationally intense work. Because of this, there is no need to scale out either Oracle BI Scheduler or the Cluster Controller. You can distribute these two processes as needed for high availability deployments, but they do not need to be scaled for capacity.

Monday 2 July 2012

Change the Date Format/ Evaluate Function

OTN forum keeps on getting the requests for changing the default date formats. They need to either pass the presentation variable into the desired date formats or change the date formats in the reports. Many blogs would represent different methods or representing them. In this post I will show three different methods of representing the Date formats and a final screen show casing the final comparison of the three methods.

I am pulling four columns-
First is the original Date column
Second is the Evaluate Date column
Third is the Custom Date column
Fourth is the Cast Date column


First method- EVALUATE Function.


Second method- Changing with custom Date format in the Data format.


Third method- Casting with Date format.


And the final comparison of the above three methods.


And also try the below formatting in the RPD side-

-In the physical layer in the schema general properties-try to change the types after searching for DATE.
-the execute on connect of the connection pool write the below code-
ALTER SESSION SET NLS_DATE_FORMAT = 'MON-YYYY'


Comments are always welcome and please add on if any other methods could do the trick.


Highest value in the narrative view/ Rank

We needed to show the Highest value for a measure column in the narrative view. The report for example will consist of two columns- dimension and measure column.
I placed a dummy column for finding the highest value of the measure by using RANK function in the column formula and calculating its position using javascript.


First will drag a dummy column of the measure and use the rank function as shown below-


Next will be using javascript to calculate the appropriate position of the 1st highest value of the measure column.


<script language="javascript" type="text/javascript">
for(var i=0;i<1;i++)
{
var a=@3;
if(a==1)
{
document.getElementById("Format").innerHTML='Biggest Profit-->@2';
}
}
</script>


And save and view the result...


Comments are always welcome...